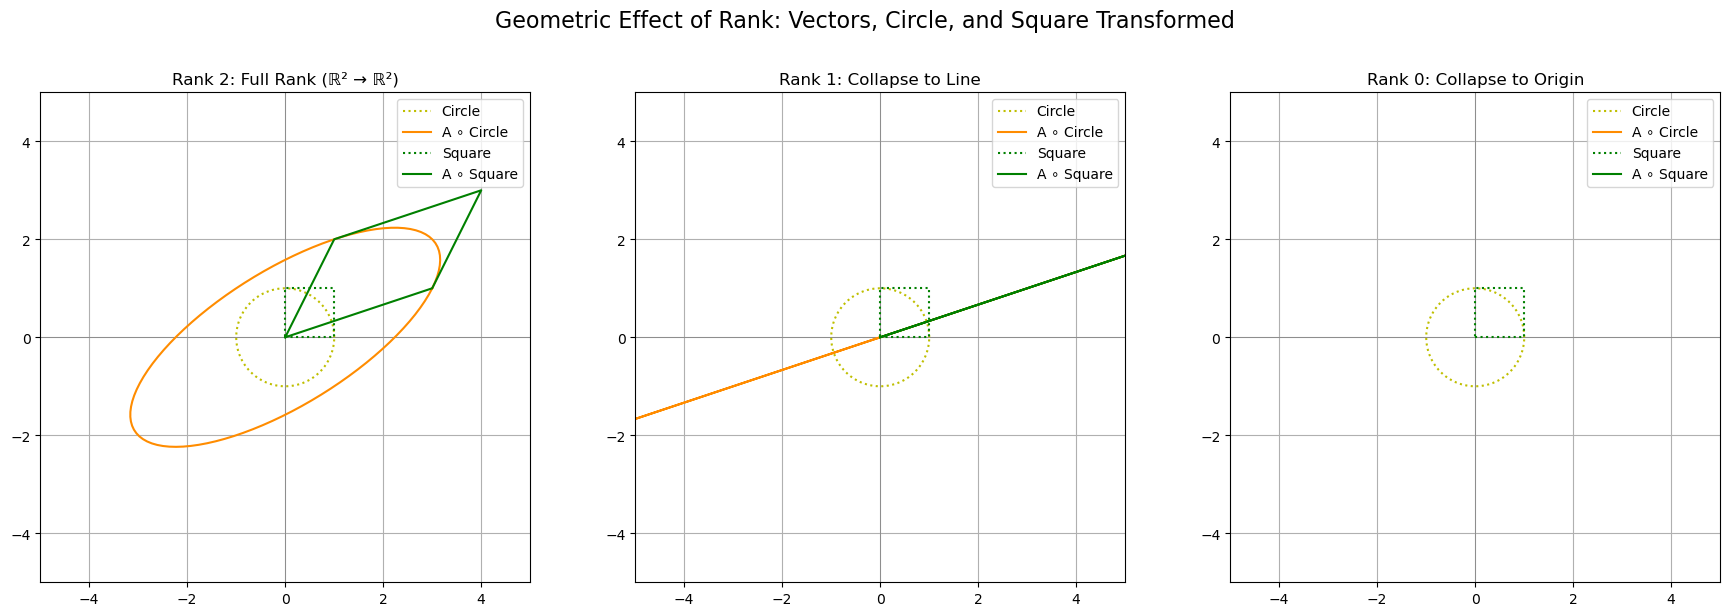
Rank of a Matrix#
Let \(\mathbf{A} \in \mathbb{R}^{m \times n}\) be a real matrix.
The rank of \(\mathbf{A}\), denoted \(\operatorname{rank}(\mathbf{A})\), is defined as:
\[
\operatorname{rank}(\mathbf{A}) = \text{the maximum number of linearly independent rows or columns of } \mathbf{A}
\]
Equivalently, it’s the dimension of the image (or column space) of \(\mathbf{A}\):
\[
\operatorname{rank}(\mathbf{A}) = \dim(\operatorname{Im}(\mathbf{A})) = \dim(\text{Col}(\mathbf{A}))
\]
✅ Interpretations#
Column Rank: The number of linearly independent columns
Row Rank: The number of linearly independent rows
For all matrices, the row rank equals the column rank, even if \(m \neq n\). This is a deep result in linear algebra.
✅ Practical View#
To compute \(\operatorname{rank}(\mathbf{A})\) in practice:
Reduce \(\mathbf{A}\) to row echelon form (via Gaussian elimination)
Count the number of non-zero rows
🧠 Summary#
\[
\boxed{
\operatorname{rank}(\mathbf{A}) = \text{dimensionality of the space spanned by the columns (or rows) of } \mathbf{A}
}
\]
Show code cell source
import numpy as np
import matplotlib.pyplot as plt

# Matrices of different ranks
A_full_rank = np.array([[3, 1],
                        [1, 2]])

A_rank_1 = np.array([[3, 6],
                     [1, 2]])

A_rank_0 = np.zeros((2, 2))

# Unit circle
theta = np.linspace(0, 2*np.pi, 100)
circle = np.stack((np.cos(theta), np.sin(theta)))

# Unit square
square = np.array([[0, 1, 1, 0, 0],
                   [0, 0, 1, 1, 0]])

def plot_transformation(ax, A, title):
    ax.set_title(title)
    ax.axhline(0, color='gray', lw=0.5)
    ax.axvline(0, color='gray', lw=0.5)
    ax.set_xlim(-5, 5)
    ax.set_ylim(-5, 5)
    ax.set_aspect('equal')
    ax.grid(True)

    # Plot transformed circle
    ax.plot(circle[0], circle[1], "y:", label='Circle')


    # Plot transformed circle
    circ_trans = A @ circle
    ax.plot(circ_trans[0], circ_trans[1], color='darkorange', label='A ∘ Circle')

    # Plot transformed square
    sq_trans = A @ square
    ax.plot(square[0], square[1], 'g:', label='Square')
    ax.plot(sq_trans[0], sq_trans[1], color='green', label='A ∘ Square')

    ax.legend()

# Plot
fig, axes = plt.subplots(1, 3, figsize=(18, 6))

plot_transformation(axes[0], A_full_rank, "Rank 2: Full Rank (ℝ² → ℝ²)")
plot_transformation(axes[1], A_rank_1, "Rank 1: Collapse to Line")
plot_transformation(axes[2], A_rank_0, "Rank 0: Collapse to Origin")

plt.suptitle("Geometric Effect of Rank: Vectors, Circle, and Square Transformed", fontsize=16)
plt.tight_layout(rect=[0, 0, 1, 0.93])
plt.show()